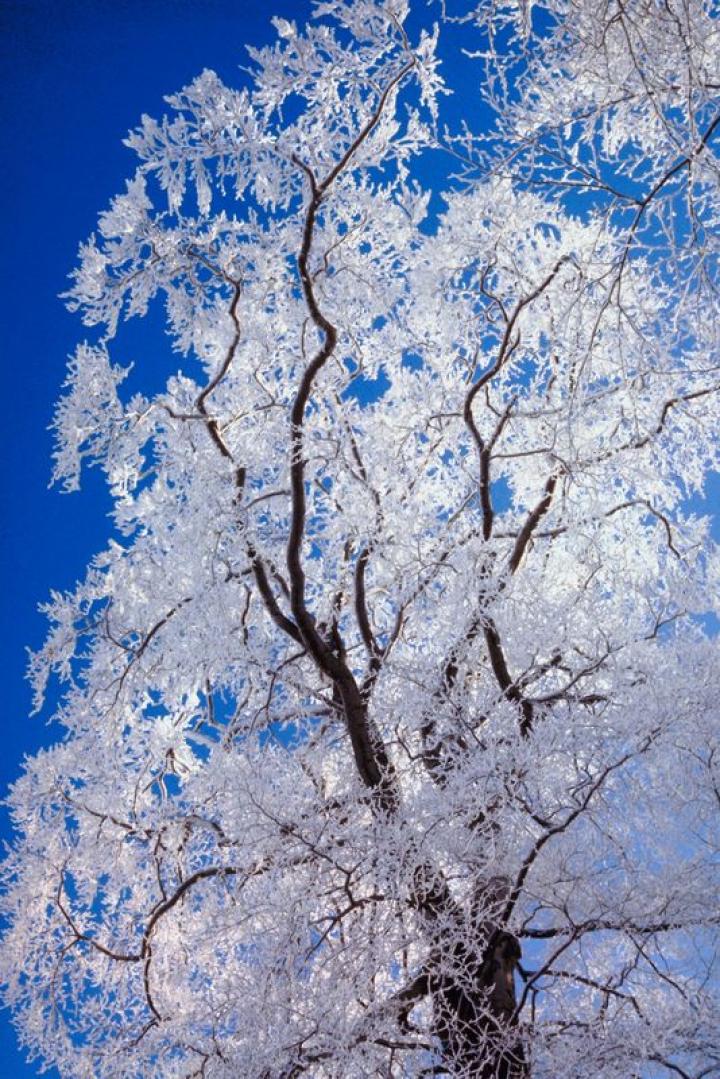
Find average frost dates for your last spring frost and first fall frost
If your town isn’t listed in the chart below, try our free Frost Calculator to get first/last frost dates by climate station and zip code. (If you’re a farmer or gardener, get planting dates based on first frost dates.)
Dates given are normal averages for a light freeze or frost (32°F); local weather and topography may cause considerable variations. The possibility of frost occurring after the spring dates and before the fall dates is 50 percent. The classification of freezing temperatures is usually based on their effect on plants, with the following commonly accepted categories:
Light freeze:
29°F to 32°F—tender plants killed, with little destructive effect on other vegetation.
Moderate freeze:
25°F to 28°F—widely destructive effect on most vegetation, with heavy damage to fruit blossoms and tender and semi-hardy plants.
Severe freeze:
24°F and colder—damage to most plants.
Frost Dates
Below are U.S. cities. Or, see Canadian cities.
City |
State |
Growing
Season
(Days)
|
Last Spring
Frost Dates |
First Fall
Frost Dates |
Juneau
AK
148
May 8
Oct. 4
Mobile
AL
274
Feb. 28
Nov. 29
Pine Bluff
AR
240
Mar. 16
Nov. 12
Phoenix
AZ
*
*
*
Tucson
AZ
333
Jan. 19
Dec. 18
Eureka
CA
323
Jan. 27
Dec. 16
Sacramento
CA
297
Feb. 10
Dec. 4
San Francisco
CA
*
*
*
Denver
CO
156
Apr. 30
Oct. 4
Hartford
CT
165
Apr. 26
Oct. 9
Wilmington
DE
202
Apr. 10
Oct. 30
Miami
FL
*
*
*
Tallahassee
FL
239
Mar. 22
Nov. 17
Athens
GA
227
Mar. 24
Nov. 7
Savannah
GA
268
Mar. 1
Nov. 25
Atlantic
IA
148
May 2
Sept. 28
Cedar Rapids
IA
163
Apr. 25
Oct. 6
Boise
ID
148
May 10
Oct. 6
Chicago
IL
186
Apr. 20
Oct. 24
Springfield
IL
182
Apr. 13
Oct. 13
Indianapolis
IN
181
Apr. 17
Oct. 16
South Bend
IN
175
Apr. 26
Oct. 19
Topeka
KS
174
Apr. 19
Oct. 11
Lexington
KY
192
Apr. 15
Oct. 25
Monroe
LA
256
Mar. 3
Nov. 15
New Orleans
LA
302
Feb. 12
Dec. 11
Worcester
MA
170
Apr. 26
Oct. 14
Baltimore
MD
200
Apr. 11
Oct. 29
Portland
ME
156
May 2
Oct. 6
Lansing
MI
145
May 10
Oct. 3
Marquette
MI
154
May 11
Oct. 13
Duluth
MN
124
May 21
Sept. 23
Willmar
MN
153
Apr. 30
Oct. 1
Jefferson City
MO
187
Apr. 13
Oct. 18
Columbia
MS
247
Mar. 13
Nov. 16
Vicksburg
MS
240
Mar. 20
Nov. 16
Fort Peck
MT
140
May 8
Sept. 26
Helena
MT
121
May 19
Sept. 18
Fayetteville
NC
221
Mar. 28
Nov. 5
Bismarck
ND
129
May 14
Sept. 21
Blair
NE
167
Apr. 25
Oct. 10
North Platte
NE
137
May 9
Sept. 24
Concord
NH
123
May 20
Sept. 21
Newark
NJ
217
Apr. 3
Nov. 7
Carlsbad
NM
215
Mar. 31
Nov. 2
Los Alamos
NM
149
May 11
Oct. 8
Las Vegas
NV
283
Feb. 16
Nov. 27
Albany
NY
153
May 2
Oct. 3
Syracuse
NY
167
Apr. 28
Oct. 13
Akron
OH
192
Apr. 18
Oct. 28
Cincinnati
OH
192
Apr. 13
Oct. 23
Lawton
OK
222
Mar. 29
Nov. 7
Tulsa
OK
224
Mar. 27
Nov. 7
Pendleton
OR
187
Apr. 13
Oct. 18
Portland
OR
236
Mar. 23
Nov. 15
Franklin
PA
163
May 6
Oct. 17
Williamsport
PA
167
Apr. 30
Oct. 15
Kingston
RI
147
May 8
Oct. 3
Charleston
SC
260
Mar. 9
Nov. 25
Columbia
SC
213
Apr. 1
Nov. 1
Rapid City
SD
140
May 9
Sept. 27
Memphis
TN
235
Mar. 22
Nov. 13
Nashville
TN
204
Apr. 6
Oct. 28
Amarillo
TX
184
Apr. 18
Oct. 20
Denton
TX
242
Mar. 18
Nov. 16
San Antonio
TX
270
Feb. 28
Nov. 25
Cedar City
UT
132
May 21
Oct. 1
Spanish Fork
UT
167
May 1
Oct. 16
Norfolk
VA
247
Mar. 20
Nov. 23
Richmond
VA
206
Apr. 6
Oct. 30
Burlington
VT
147
May 8
Oct. 3
Seattle
WA
251
Mar. 10
Nov. 17
Spokane
WA
153
May 2
Oct. 3
Green Bay
WI
150
May 6
Oct. 4
Sparta
WI
133
May 13
Sept. 24
Parkersburg
WV
183
Apr. 21
Oct. 22
Casper
WY
119
May 22
Sept. 19
* Frosts do not occur every year.
For more locations click here.

Source:
Courtesy of National Climatic Center


